
Follow @ARSLab_CU
[fusion_builder_container hundred_percent=»no» equal_height_columns=»no» menu_anchor=»» hide_on_mobile=»small-visibility,medium-visibility,large-visibility» class=»» id=»» background_color=»» background_image=»» background_position=»center center» background_repeat=»no-repeat» fade=»no» background_parallax=»none» parallax_speed=»0.3″ video_mp4=»» video_webm=»» video_ogv=»» video_url=»» video_aspect_ratio=»16:9″ video_loop=»yes» video_mute=»yes» overlay_color=»» video_preview_image=»» border_color=»» border_style=»solid» padding_top=»» padding_bottom=»» padding_left=»» padding_right=»» type=»flex»][fusion_builder_row][fusion_builder_column type=»1_1″ layout=»1_1″ background_position=»left top» background_color=»» border_color=»» border_style=»solid» border_position=»all» spacing=»yes» background_image=»» background_repeat=»no-repeat» padding_top=»» padding_right=»» padding_bottom=»» padding_left=»» margin_top=»0px» margin_bottom=»0px» class=»» id=»» animation_type=»» animation_speed=»0.3″ animation_direction=»left» hide_on_mobile=»small-visibility,medium-visibility,large-visibility» center_content=»no» last=»true» min_height=»» hover_type=»none» link=»» border_sizes_top=»» border_sizes_bottom=»» border_sizes_left=»» border_sizes_right=»» first=»true»][fusion_text columns=»» column_min_width=»» column_spacing=»» rule_style=»default» rule_size=»» rule_color=»» content_alignment_medium=»» content_alignment_small=»» content_alignment=»» hide_on_mobile=»small-visibility,medium-visibility,large-visibility» sticky_display=»normal,sticky» class=»» id=»» font_size=»» fusion_font_family_text_font=»» fusion_font_variant_text_font=»» line_height=»» letter_spacing=»» text_color=»» animation_type=»» animation_direction=»left» animation_speed=»0.3″ animation_offset=»»]
Originally published in The Conversation on June 22, 2020
As the world moves past the first 100 days of the pandemic, the number of new daily cases continues to rise in some countries. By June 22, the number of confirmed cases worldwide reached nine million, with over 469,000 deaths and about 160,000 new cases a day.
The infection rate has been greater in African American and Indigenous people in the United States (and elsewhere), due to chronic structural and economic inequalities.
It is expected that there will be a second wave of COVID-19 — and possibly more — that could be even more deadly than the current one. We should be better prepared, and modelling and simulation can be useful to predict the evolution of the disease, help reduce the spread of infection and inform public and private policies in terms of prevention. We still have time.
Second waves
Herd immunity happens when 60 to 70 per cent of the population has been infected by a virus and become immune to it. If this proportion of the world population gets the disease, the consequences will be catastrophic, with millions of individuals dying.
Herd immunity can only happen in a safe and ethical way if a vaccine is discovered and a high proportion of the population is inoculated. Unless a vaccine is discovered, we can only deal with the pandemic through behaviour: physical distancing, the use of masks, cough and sneeze etiquette and extensive hand-washing.
We have seen physical (social) distance rules that go from simple recommendations to strict quarantines. But physical distancing has had economic and mental health consequences.
Increasing frustration
History has shown us that the second wave of a pandemic can be more lethal. With mounting frustration and limping economies we might expect a strong resurgence in coronavirus infections.
The second wave of the 1918 flu seems to have been boosted by travelling soldiers, a probable mutation in the virus and because governments were not willing to impose physical distancing measures during the First World War.
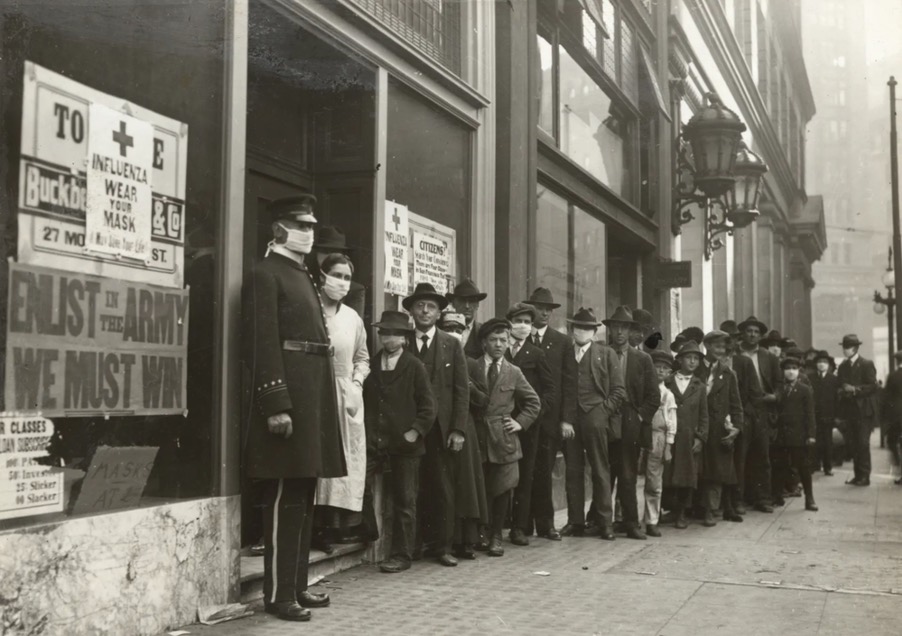
Public frustration was a main cause for the protests by the Anti-Mask League in San Francisco in response to early and mandatory use of masks in 1918. Social unrest resulted in inconsistent policies between October 1918 and January 1919, causing nearly 45,000 cases of influenza that killed over 3,000 individuals in San Francisco.
With COVID-19, we are seeing frustration all over the world. In Brazil, hundreds protested stay-at-home orders issued by state governors. Similar protests have been seen in Spain, Germany and Argentina, where protests could cause the number of cases to bounce back.
An increase of cases in Ontario seems to have been related to when families stopped physical distancing for Mother’s Day.
Currently, the Black Lives Matter mass protests in the United States are being studied to see if there will be a corresponding increase in cases. This happened in Philadelphia in 1918, after a massive parade celebrating the end of the war resulted in a widespread outbreak.
Recently, we have seen new outbreaks reported in South Korea, China, Germany and Singapore. A second wave could potentially overwhelm health-care facilities.
Helpful simulations
Government agencies base their decisions on the results of advanced models and simulations.
German Chancellor Angela Merkel publicly discussed how to control a second wave and the lockdown policies in Germany and presented results based on the calculation of the reproduction factor (also known as R). But what is that?
R represents how many people, on average, one person with a disease will infect. R0, the basic rate of infection for COVID-19, was calculated to be between two and three. This means that with no immunity or interventions, every infected person would infect an average of two to three others. This would produce an exponential growth of the disease.
R0 is a theoretical number that is calculated using a combination of daily real-world data and simulation models that predict the spread of the pandemic. The Rt of a disease is dynamic and affected by external factors such as vaccination, isolation or the weather.
Tracking Rt is important when we want to loosen restrictions, as an Rt greater than one means the number of cases is growing. When Rt is less than 1, the disease starts to disappear, but even small increases above one will produce an exponential increase of the cases.
Classifying the population
Susceptible individuals are those who have yet to contract the disease. Those who contracted it — referred to as infectives — can transmit it to other susceptible people. Those who cannot continue spreading the disease because they recovered (or died) are removed from the study. These S-I-R models and their simulations can be used by governments to determine what interventions and policies they should implement. Simulations can measure the impact of an intervention, compare two interventions or how the timing of their introduction affects the outcome.
In addition to models and simulations, governments must make massive investments into contact tracing. Contact tracing tries to stop the chains of transmission by identifying the individuals who need to self-isolate to reduce the chance of contagion.
The new normal
When the quarantine ends, we will need to head back to workplaces, schools, social events and use public transportation. Unfortunately, most infections occur indoors and around 40-60 per cent of infective individuals have no symptoms for four to five days.
Without proper contact tracing or precise models, the virus could have a stronger impact in the second wave. Our research group is investigating different methods to study how the virus spreads indoors, such as in office buildings, schools and senior care centres.
We are building indoor models using factors like different occupation density, gender, age, pre-symptomatic transmission and contact tracing. These models allow us to study different scenarios, various infection rates and environmental factors like pedestrian flow, room temperature and humidity.
Knowing that most infections occur indoors, modelling and simulation tools can help governments, companies, school boards and universities re-introduce strict lockdown measures or experiment with different options to reduce the probability of indoor contagion. So far, a small percentage of the population has been infected and until a vaccine is available, a second wave could be very dangerous.
Breath particles spread in a research lab, Carleton University.
Mixing simulation results with advanced visualization tools and contact tracing we can help decision makers to take the best possible course of action. We will need the right tools to dominate the second wave by making informed and comprehensive policy decisions.
[/fusion_text][/fusion_builder_column][/fusion_builder_row][/fusion_builder_container]